An interactive HTML document will open with the results.
In RStudio this will open in the source pane; click “show in new window” button to open the document in a new window.
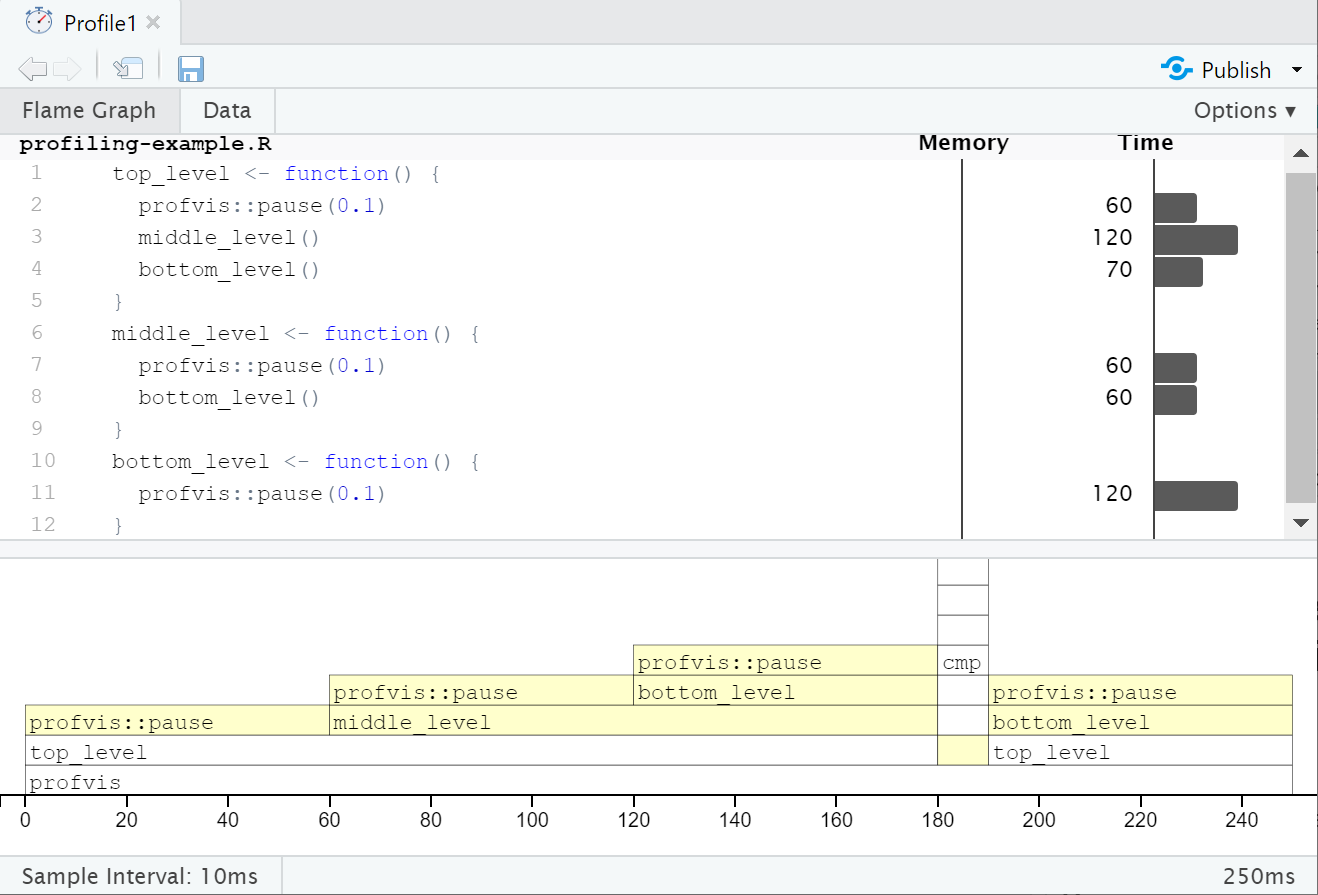
Screenshot of the profvis HTML output. At the bottom, a stacked set of horizontal bars along a time axis, representing the length of time in each function. At a given time, the top-level function is at the bottom of the stack with each nested function stacked on top. The source code is shown at the top of the screenshot, with a horizontal bar for each line, showing the time spent. Interpretation on next slide
Interpretation
In the flame graph the yellow bars correspond to lines in the source file shown above the graph. The plot is interactive.
In the overall time of 250ms we see:
4 equal-sized blocks for each pause of 0.1s
Nearly all time is spent in the top-level function
Nearly half the time is spent in the mid-level function
Nearly half the time is also spent in the bottom-level function
The cmp function is called as R tries to compile new functions so that it can call the compiled version in subsequent calls.
No objects are created or deleted: no memory changes.
Data tab
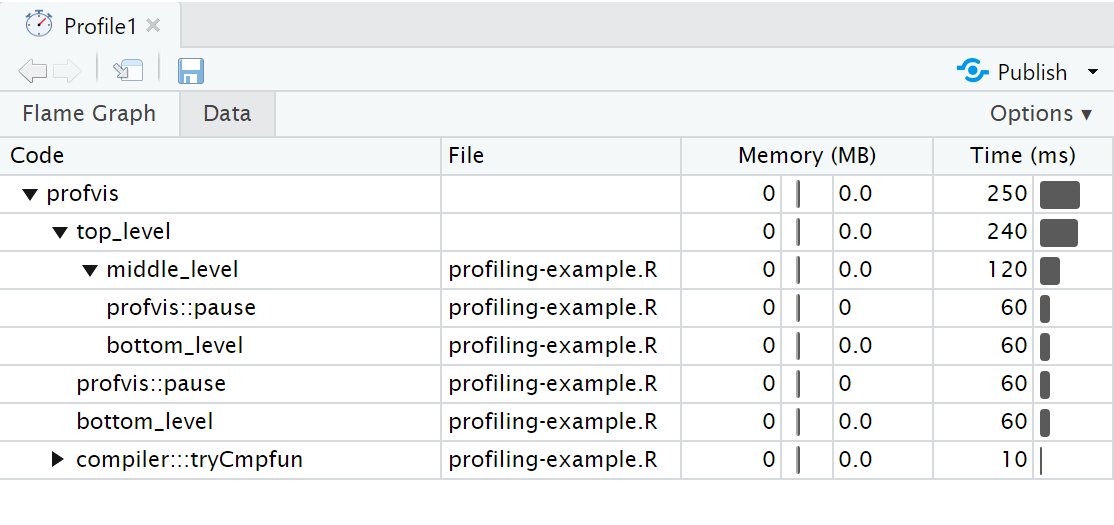
The Data tab shows a table with the memory and time usage for each function call. The nested calls can be expanded/collapsed to show/hide the corresponding lines.
Screenshot of the data tab in the profvis HTML output. A table with columns “Code” (function name), “File” (name of source file containing function), “Memory (MB)” and “Time (ms)”.
Memory profiling
To illustrate memory profiling we can consider a loop that concatenates values.
As it is a small code snippet, we can pass to profvis() directly
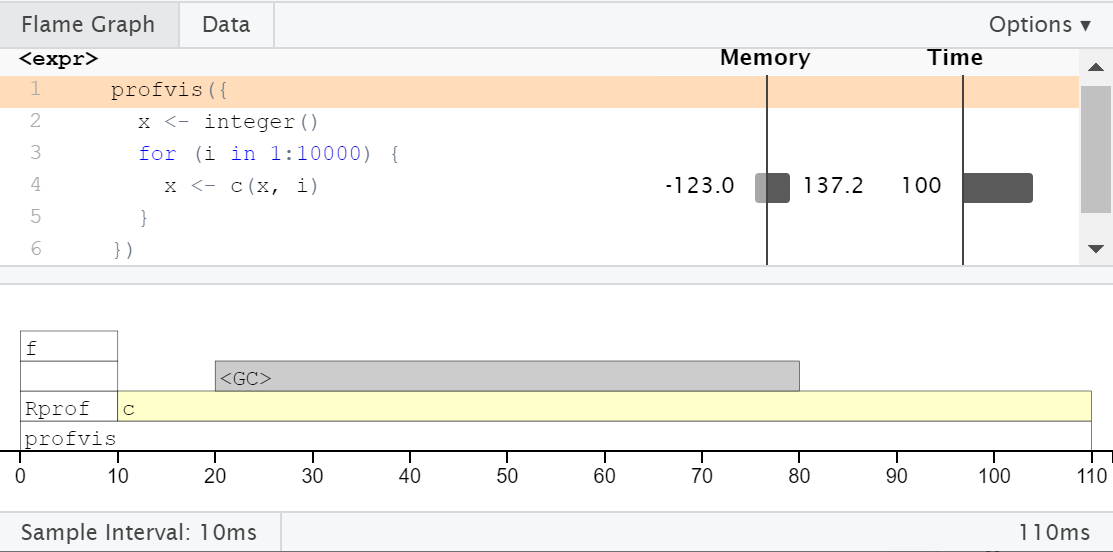
profvis({ x <-integer()for (i in1:10000) { x <-c(x, i) }})
Flame graph for profiling the contenation example. Interpretation on next slide.
<GC>
As expected, the majority of the time is spent within c(), but we also see a lot time spent in <GC>, the garbage collector.
In the memory column next to the corresponding line in the source code, we see a bar to left labelled -123.0 and a bar to the right labelled 137.2. This means that 137 MB of memory was allocated and 123 MB of memory was released.
Each call to c() causes a new copy of x to be created.
Memory profiling can help to identify short-lived objects that might be avoided by changes to the code.
Monopoly
In the game of Monopoly, players roll two die to move round the board. Players buy assets on which they can charge rent or taxes and aim to make the most money.
The squares on the board represent
Properties, train stations or utility companies to buy
Events that trigger an action, e.g. paying a tax or going to jail
The efficient package contains the simulate_monopoly() function to simulate game play; we’ll use this to practice profiling.
Your turn!
Install the efficient package with the following code to keep the code source files:
Use profvis() to profile simulate_monopoly(10000). Explore the output. Which parts of the code are slow?
Most of the time is spent in the function move_square(). Use View(move_square) to view the source code. Copy the code to a new .R file and rename the function move_square2. Edit move_square2() to speed up the slow parts of the code. (Go to next slide for testing the updates)
Your turn! (continued)
Create a wrapper to run a specified move square function n times with different seeds:
run <-function(n, fun){ x <-numeric(n)for (i inseq_len(n)) {set.seed(i) x[i] <-fun(1) } x}
Run bench::mark(run(n, move_square), run(n, move_square2)) with n = 1000 to test your changes.
Finally, compare profvis(run(n, move_square)) with profvis(run(n, move_square2)).
General principles
Avoid optimizing too soon
Get the code right first
Avoid over-optimization
Focus on the bottlenecks
Keep an eye on the units - will real gains be made?
Think about maintainability: readability, simplicity, dependencies
Avoid anonymous functions
Name utility functions to see them in the profile
Use benchmarking to assess alternative implementations
C++ and Rcpp
In the next session, we’ll cover using C++ via Rcpp to rewrite R code that has been identified through profiling as causing bottlenecks in your code.
End matter
References
Wickham, H, Advanced R (2nd edn), Improving performance section